In baseball (as in nearly everything else), you get what you pay for, right?
Ladies and gentlemen, I am getting old. It’s been over a decade since I wrote things like this.
Becoming an adult has been an interesting experience to say the least, but no one ever tells you how you become an adult. Like, I’ve been an “adult”, but I haven’t felt like an adult. I think, as a kid, you just look at adults, and you’re like, “They have it all figured out. They know what they’re doing.”
Turns out, that’s not how it works.
At least from my experience, my most “adult” moments have come because I am focusing more on need than wants and being … not excited but … very interestedly involved in the decision-making process. As an example, my wife and I built a new house a few years ago, and when we sat down to really plan out filling the house, we started with vacuums.
Why vacuums? Well, the one we had made … a smell whenever we used it. We needed a new one, but we had to decide how much to spend on it. We did … a lot of research, and we came down to two choices – a Dyson and a lesser-known brand that was also good with cat hair (we had two cats at the time).
The choice came down to this. If we want to keep this house clean from all the cat hair and everything else, how much is that worth to us? We (fortunately) had the money to spend, but we had to decide if that was the right thing to do. The Dyson was the clearly better choice and meant years of a clean carpet, but the other one was fine, too. Was the extra money worth it?
Teams have to make similar choices with their payroll. Spending more money and on better players makes the team better, but how much better? Is it really worth spending at the top of the league, or can we just get away with spending a decent amount and hoping for the best?
Let’s look at the Atlanta Braves spending from 2012-2024. Why those years, you ask? Mostly because it’s about as far back as Spotrac goes in terms of keeping payroll. So yeah, I’m sort of cherry-picking, but it’s not a bad sample size.

The payroll line is in the millions, and you can see the steady increase over the years (2020 is pandemic dollars). So what’s the SD?
SD here is the Standard Deviation. What is a standard deviation?
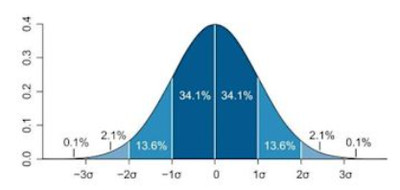
The easiest way I can explain it is to think of the 20-80 scale in terms of scouting. 50 is average, and the standard deviation is 0. A 60 grade (more or less an All-Star player) is 1 standard deviation above that, and a 40 is one standard deviation below. In more science-y terms, the below graph gives you an idea of what the population looks like inside of standard deviations.

Mark, why are you going through this? In this case, standard deviations help us compare across years. Atlanta spending $153 million in 2021 is obviously less than the $236 million in 2024, but considering inflation and such, that doesn’t really help us. What we want to look at is the team’s spending versus the rest of the league over time. Standard deviations help us do that. And you can see that Atlanta’s payroll has grown, but their status as one of the higher spenders in MLB has increased as well.
What you can see from the chart above is that Atlanta was aggressively underspending the rest of the league in the mid-2010s, but that was also during the rebuild. If I expand my chart, you can see how it went up as wins went up.

I included the number of wins here along with the comparison to the rest of the league. Reg Rank is where Atlanta ranked in terms of wins in MLB that year, and the Play Rank is where they ranked in the playoffs – more or less, how deep did they get.
The Play Rank is a weird thing I did, but I went back and ranked all of the teams in the playoffs of the respective season. The champion is number 1, the runner-up was number 2, and then I started going back-and-forth with who lost to who (number 3 is who lost to the champion, number 4 lost to the runner-up, and so forth).
What I wanted to see was does spending matter for the regular season? And does it matter in terms of how deep you go in the playoffs?
Let’s start with the regular season.
To talk about this, we have to add in another statistics term – correlation. Basically for this exercise, how much does winning increase as spending increases? In terms of the below chart, the scores can range from -1 to 1. The positive side means as spending increases so does winning, and a negative side would mean that winning decreases as spending increases.

The years jump around on us (as you might expect), but generally speaking, there is a decent connection between winning and spending. Spending isn’t the only important thing, of course – you have to make good decisions, injury luck, etc. – but that’s a pretty decent correlation between the two.
What about the playoffs?

A little less correlation here, but it’s still significant. Why is it negative? I ranked teams from 1-(however many teams there were in the playoffs that year), so we expect the relationship to be negative because the best thing is to be #1, although it’s a smaller number. So as spending increased, teams made it further in the playoffs (generally).
Okay, so spending money is good, but we knew that, right? This just confirms it. Better teams usually have better players, players further along the arbitration process, etc., so this makes sense.
But what about spending at the upper echelon (in our case, a standard deviation of 1 or above)? How does that impact making the playoffs and winning a championship?

The Playoff% here is the percentage of teams that spent at or above a standard deviation of 1 that made the playoffs. You can see there’s a pretty clear trend of that mattering more and more over the past decade. I think it boils down to a couple things – expanded playoffs and teams getting better about spending money. But if you spend a lot, it seems to give you a preeeetty good chance at getting to the playoffs.
What about winning a title? It’s a common theme when talking about the playoffs in baseball that you just need to get in. While that certainly is the case, nearly half of the champions of the past 13 seasons spent at the highest levels, and 4 of the past 7 and 5 of the last 9 have done so. Spending at those levels doesn’t guarantee you a title, but it seems like there’s about a 40-50% chance that you need to spend at those levels to win a World Series.
All of that to say, the old adage of “you get what you pay for” continues to ring pretty true. Spending correlates pretty well to winning, and spending at the highest levels, while it doesn’t guarantee a title, is still a good idea.
And I’m still pretty happy with my Dyson.
