Our final day is all about the digital aesthetic of the passing game.
Hello, friends — welcome to Analytics Week. For five of our 100 Days to Kickoff, FTRS is bringing you college football analytics content, powered by our friends at cfbfastR, nflfastR, and Statsbomb.
We’ve spent the last four days talking through football analytics at a high level and grounding data concepts in reality. Like I said yesterday:
Fundamentally, we inherently understand these concepts as parts of the game; they’re things we can see and feel, and the only thing a computer is doing is just quantifying those feelings.
We’re not teaching anyone advanced math when we do this kind of work — we’re teaching them some deeper truth about the game and how to be “good” at it.
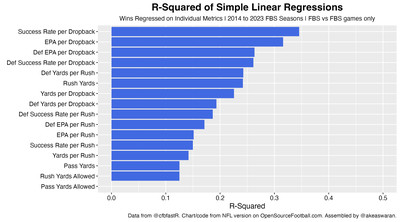
Part of our discussion this week has centered around using EPA as a “truer” measure of offensive ability than yards. We can take this one step further and use EPA to split offensive ability by rush and pass: if EPA is better than yards in the aggregate, then it makes sense that it should also be better at these more micro levels. To see if that’s valid, let’s compare the R-squared values of yards and EPA splits (among other stats) when correlated to season win totals:
For context, here are the same trends for the NFL (we set the axes limits on the CFB chart to match these for easy comparison):
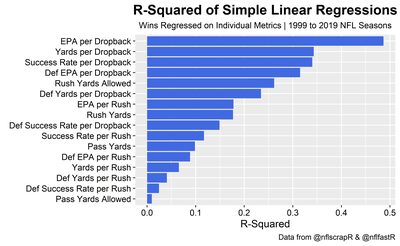
OpenSourceFootball.com
If EPA per dropback (AKA: EPA per pass) can explain 31% of the variance in season win totals by itself (admittedly not as large of an effect as in the NFL, but still significant), then it follows that tweaking the way we throw the ball might lead to more wins down the line.
Let’s look at the state of passing in CFB today using our dataset from earlier this week (~1.2M total plays, ~700 games, 10 seasons). First, we might want to compare passing and rushing in general, using a common unit of value in EPA:
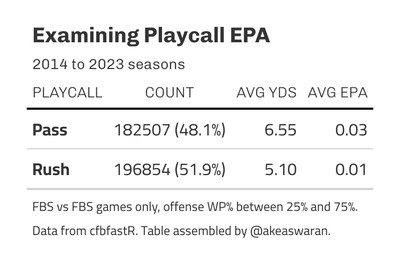
In aggregate, teams are generally rushing more (albeit just slightly), but passing is significantly more valuable.
Let’s tackle this increased rush rate first. We talked yesterday about how a quarterback’s decision to target a specific receiver is a mental risk-reward calculation that we can model numerically using expected completion percentage and expected points. Over the years, our brains have mapped a similar opportunity cost analysis on to the dichotomy of passing and rushing: throwing the ball is typically seen as a riskier proposition (remember that “three things can happen when you throw the ball, and two of them are bad”), while running it is safe and secure. The way in which we’ve mapped risk onto those playcalling choices can very clearly be seen when thinking about game state (IE: if an offense is winning or losing). game state encourages changes in playcalling: as the game winds down, winning teams typically run the ball more to defend their lead and bleed clock (IE: they accept less risk as they no longer need a reward), while losing teams pass more to put up points quickly (IE: they take on more risk to get more potential reward). We remember the notable examples in which teams didn’t adhere to these risk principles and failed to capitalize on their situations: to this day, Falcons fans (read: me, myself, and I) hold a grudge against former offensive coordinator Kyle Shanahan for continually pushing the Falcons’ advantage late in Super Bowl LI by throwing the ball instead of bleeding the clock with chunk runs (and we all know how that strategy paid off).
Setting the existential dread of a lost championship aside, we can see this risk analysis come through in the data as well, when we compare dropback rates across different win probabilities (a numerical version of game state):
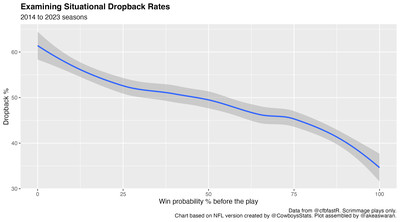
Put another way (note that rush rate, not dropback rate, is the Y axis here):
For fun I recreated one of my favorite football graphs but for the college game to see if there was any difference. Nope! Teams with leads run when they’re up, pass when they’re down #CFB #CollegeFootball https://t.co/RgC9DINgUY pic.twitter.com/XTD1OoqsEo
— CFBNumbers (@CFBNumbers) September 30, 2021
As for the increased value of passing, let me ask you, dear reader: how many times have you seen Tech force a rusher into a tiny gap on first-and-ten for two yards (if they’re really lucky)? Even after the Paul Johnson era, the answer is surely a hearty “Plenty”! If we take a wider lens and look at the density plots for the yards gained on completed passes versus rushes in our entire dataset (incomplete passes would obviously skew these densities so we’ll ignore them for now):
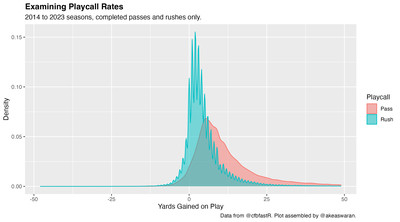
Our lived experience actually bears out here: most passing plays are medium chunk plays (see there the peak of the red curve is), while most rushing plays are smaller gains (the peak of the turquoise curve). We don’t even have to adjust for the unit inequality of yards here: gaining fewer yards on a player is generally going to be less valuable, regardless of situation.
We might next want to look at how down and distance affect coaches’ choice to throw or run. Using our dataset, we can plot this relationship like so:
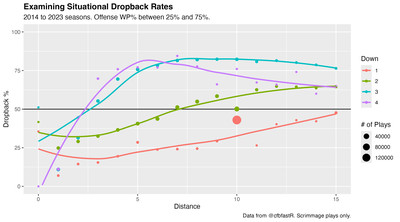
Teams generally get more pass-heavy as the distance increases and as they get later in a set of downs, with the exception of fourth-and-long plays. But this says nothing of the outcome of these plays, just the decision a coach made on the play. To evaluate these outcomes, let’s plot average passing versus rushing EPA at various downs and distances:
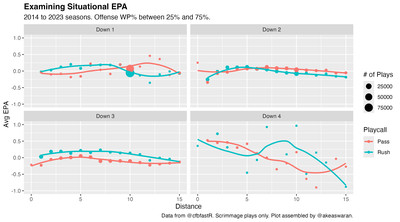
There are some interesting things to learn from these two plots:
- Passing on first-and-10 and second-and-long is more advantageous than rushing in those situations, and passing on second-and-six to second-and-11 adds value. This is one of the things that analytics Twitter tends to get on the case of coaches for: rushing on early downs (first and second down) is less advantageous, but coaches primarily run the ball on first down and are not committed to rushing as they could be in second-and-medium (although, to the credit of the average CFB coach, they pass on second-and-seven or better far more often than I thought they would).
- Rushing is generally more valuable on third down, despite teams primarily throwing the ball on third down. The crossover point for both pass-first offenses and rushing being more valuable is right around two yards to go. It’s immediately unclear to me why this is the case: my gut feeling is that because teams throw more often on third down, they throw more incomplete passes, which are generally negative EPA and lower the average value of a third-down pass, regardless of distance. It’s also possible that defenses are dropping back to defend the pass more often on third downs, allowing offenses to generate chunk runs underneath and set up more convertible fourth downs (which they are going for more and more often these days).
You’ll notice that in each of these data visualizations, we’ve added a win probability filter on our queries — why? From our analysis of dropback rate across different win probabilities, we know that game state changes playcalling; if we eliminate situations where teams are incentivized to play a certain way because of the game state (IE: we consider only ‘neutral’ game states for analysis), we can identify team tendencies much more clearly.
But let’s get back to the main point of this piece (and really the whole point of this week): if passing has a higher EPA and generally higher EPA means more wins, then why don’t teams pass all the time? In fairness, some do: Mike Leach (RIP) and those that have branched off of his coaching tree and freestyled on the air raid have conceived, designed, and executed pass-dominant offenses for decades at this point. But of course, the truth of the matter is (of course) more complicated: the answer should be “our choice to pass depends on the situation”.
However, that’s not how the general public understands the implementation of analytics in sport. Our extreme framing here reflects the nature of some in mass media to treat analytics implementation at sports franchises as a boogeyman. You’ve probably seen this something like this before: a national radio host goes live, complaining to his audience about the scourge of analytics and how it’s condensed a complex and beautiful game into a sequence of inscrutable numbers that a coach is forced to listen to without any human input, lest he be fired and banned from duty for insubordination against the almighty God of Numbers.
But, as we’ve established this week, the numbers aren’t that scary, and rarely is someone (other than Billy Beane to Art Howe in Moneyball) asking a coach to dogmatically follow the numbers. As we’ve established before:
But how different is this from how we’ve framed analytics work?
[T]he point of analytics work is (simply put): figuring out how to win games sustainably. What things are “good” things? How can we do “good” things more often? These are questions that a computer can identify given a little human prodding and a large descriptive dataset about the game. We’re focused on finding these deeper truths about how to win and how we can implement them…
Both spheres — coaching and analytics work — are trying to solve the same problem, just in different ways. In some cases (traditional film study versus Statsbomb’s computer-tagged play-by-play), they’re trying to solve the same problem in the same way, just with different levels of efficiency.
The point of an analytics team then isn’t to offer numerical dogma as a curse as our (surely totally fake) radio host argues: it’s to inform and support, to create symbiosis between a wealth of digital information and lived experience. But don’t take this from me — instead, take it from Seattle Mariners director of baseball strategy Skylar Shibayama, whose partnership with Mariners manager Scott Servais was profiled by their hometown Seattle Times:
“It’s just an all-hands-on-deck-type thing,” Shibayama said. “You have to have really good info. You have to be really good at communicating that info. And you have to have the systems [to put the information to use].
“I think that’s a real strong point for us. I really don’t get the sense of, like, this antiquated ‘Moneyball’ nerds-versus-coaches thing. Everybody is just trying to be as good as possible.”
At the end of the day, we’re all focused on process. Good process leads to good outcomes. Good process is built off good information, and its wheels are greased by good people, good communication, and good collaboration. We’re all trying to solve the same problems, and working together is the best way to solve them.